Table of contents
Uploading the NYPD historical crime data by precinct
The NYPD publishes a few spreadsheets containing historical tallies of crimes per precinct. I've created a separate repo that details the steps needed to get the data into database form.
However, you can access the database-ready compiled CSV at this URL, which you can upload directly to CartoDB.
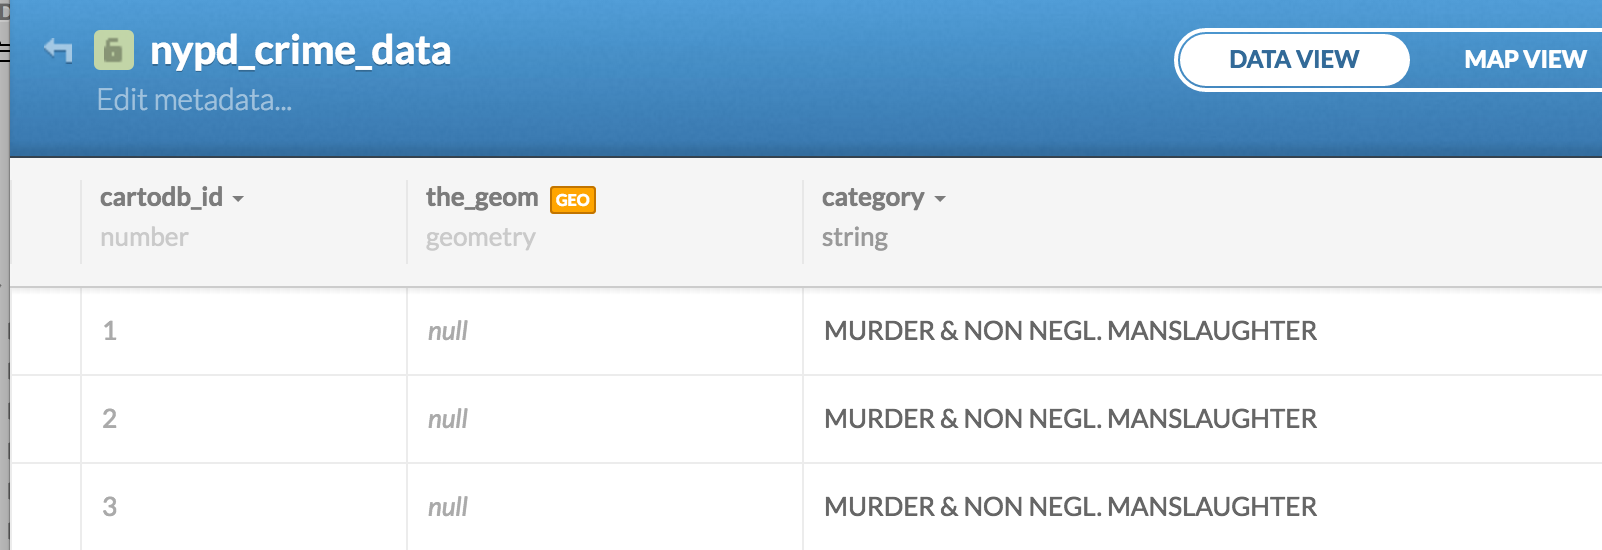
I'm calling this table nypd_crime_data.
By default, when we upload a dataset to CartoDB, the fields cartodb_id and the_geom are added, even if the data is not inherently geospatial:
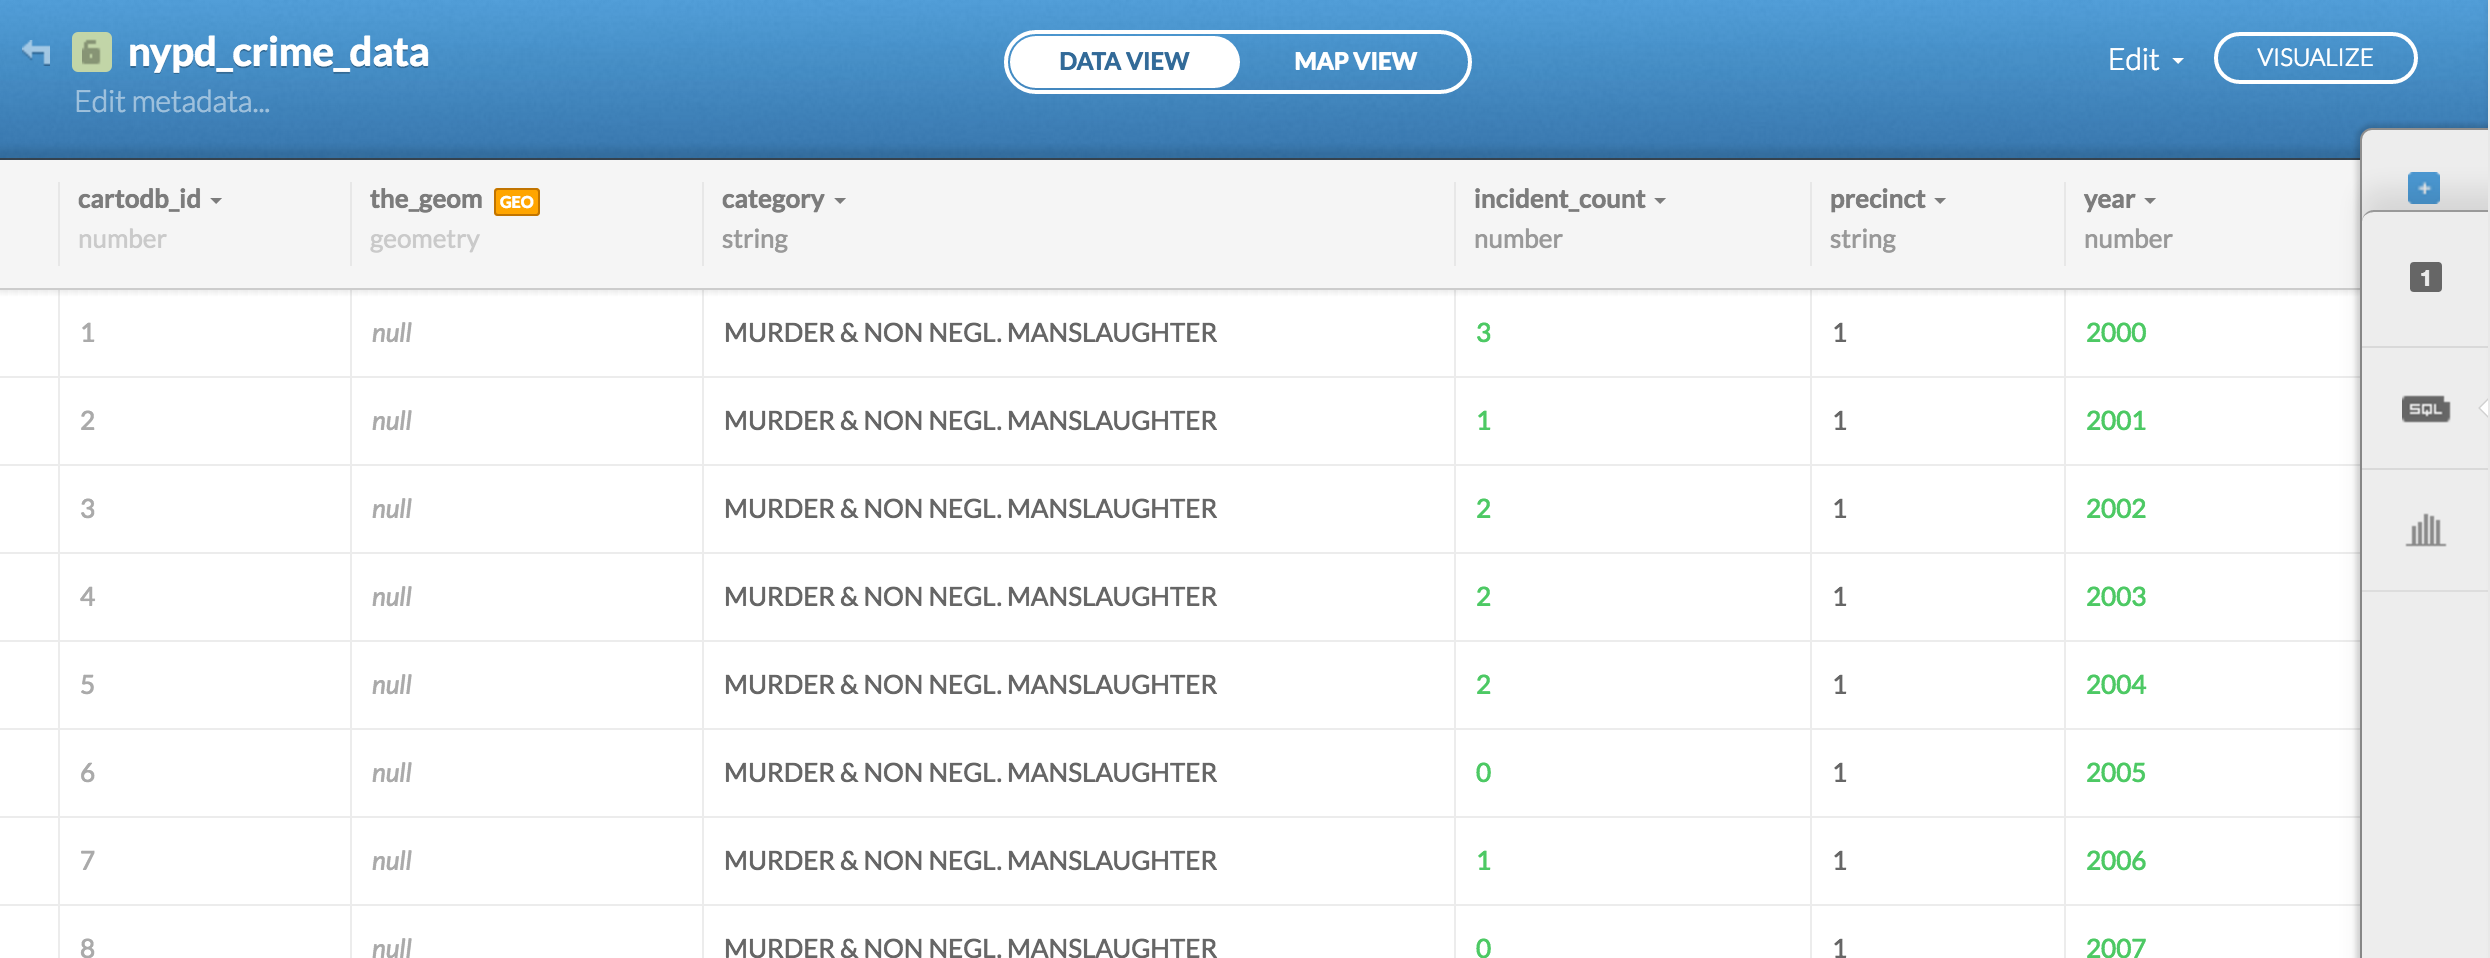
We'll worry about the details of those concepts later. But right now, we can immediately experience the implications. Try clicking the MAP VIEW button to get the map view of the newly-uploaded crime data. You should get a screen like this:
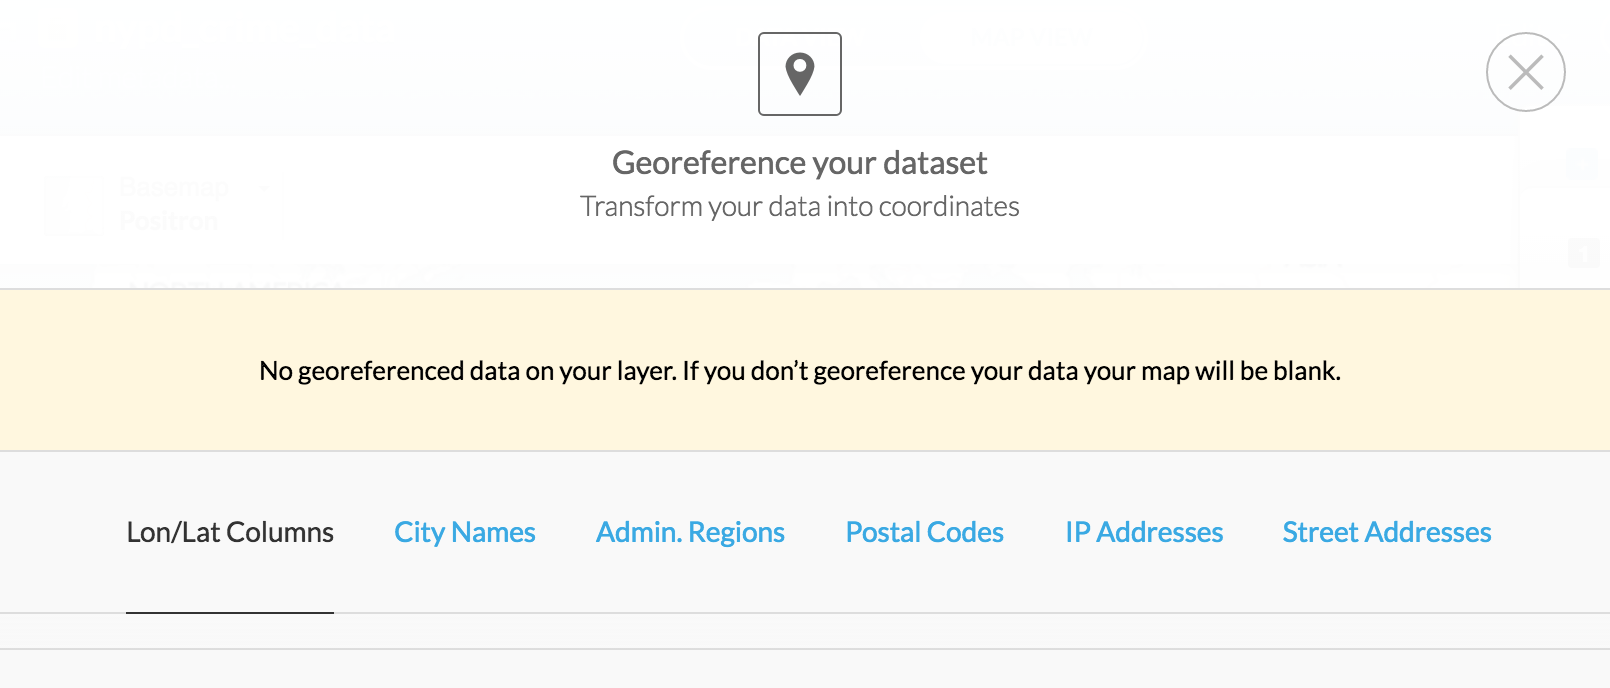
There's nothing in our nypd_crime_data table to tell how CartoDB should make a map – it's just numbers and descriptions of crime, after all.
So this is where knowing SQL is key: we will be joining nypd_crime_data to our nypd_precincts table.
To tie this crime data to map elements, we use SQL to join the data with the NYPD precinct shapefile based on the precinct column (i.e. the precinct number).
One of the great features of CartoDB is the ability to run raw SQL on your datasets. Let's test it out by running a routine COUNT-type query to get a frequency count of the crime categories.
First, click the SQL button in the side-panel to pop open the SQL Panel
SELECT
  category,
  SUM(incident_count) AS total_incidents
FROM nypd_crime_data
GROUP BY category
ORDER BY total_incidents DESC;
Then, just type in the query and hit the Apply query button. The results of that query will show up in the main window:
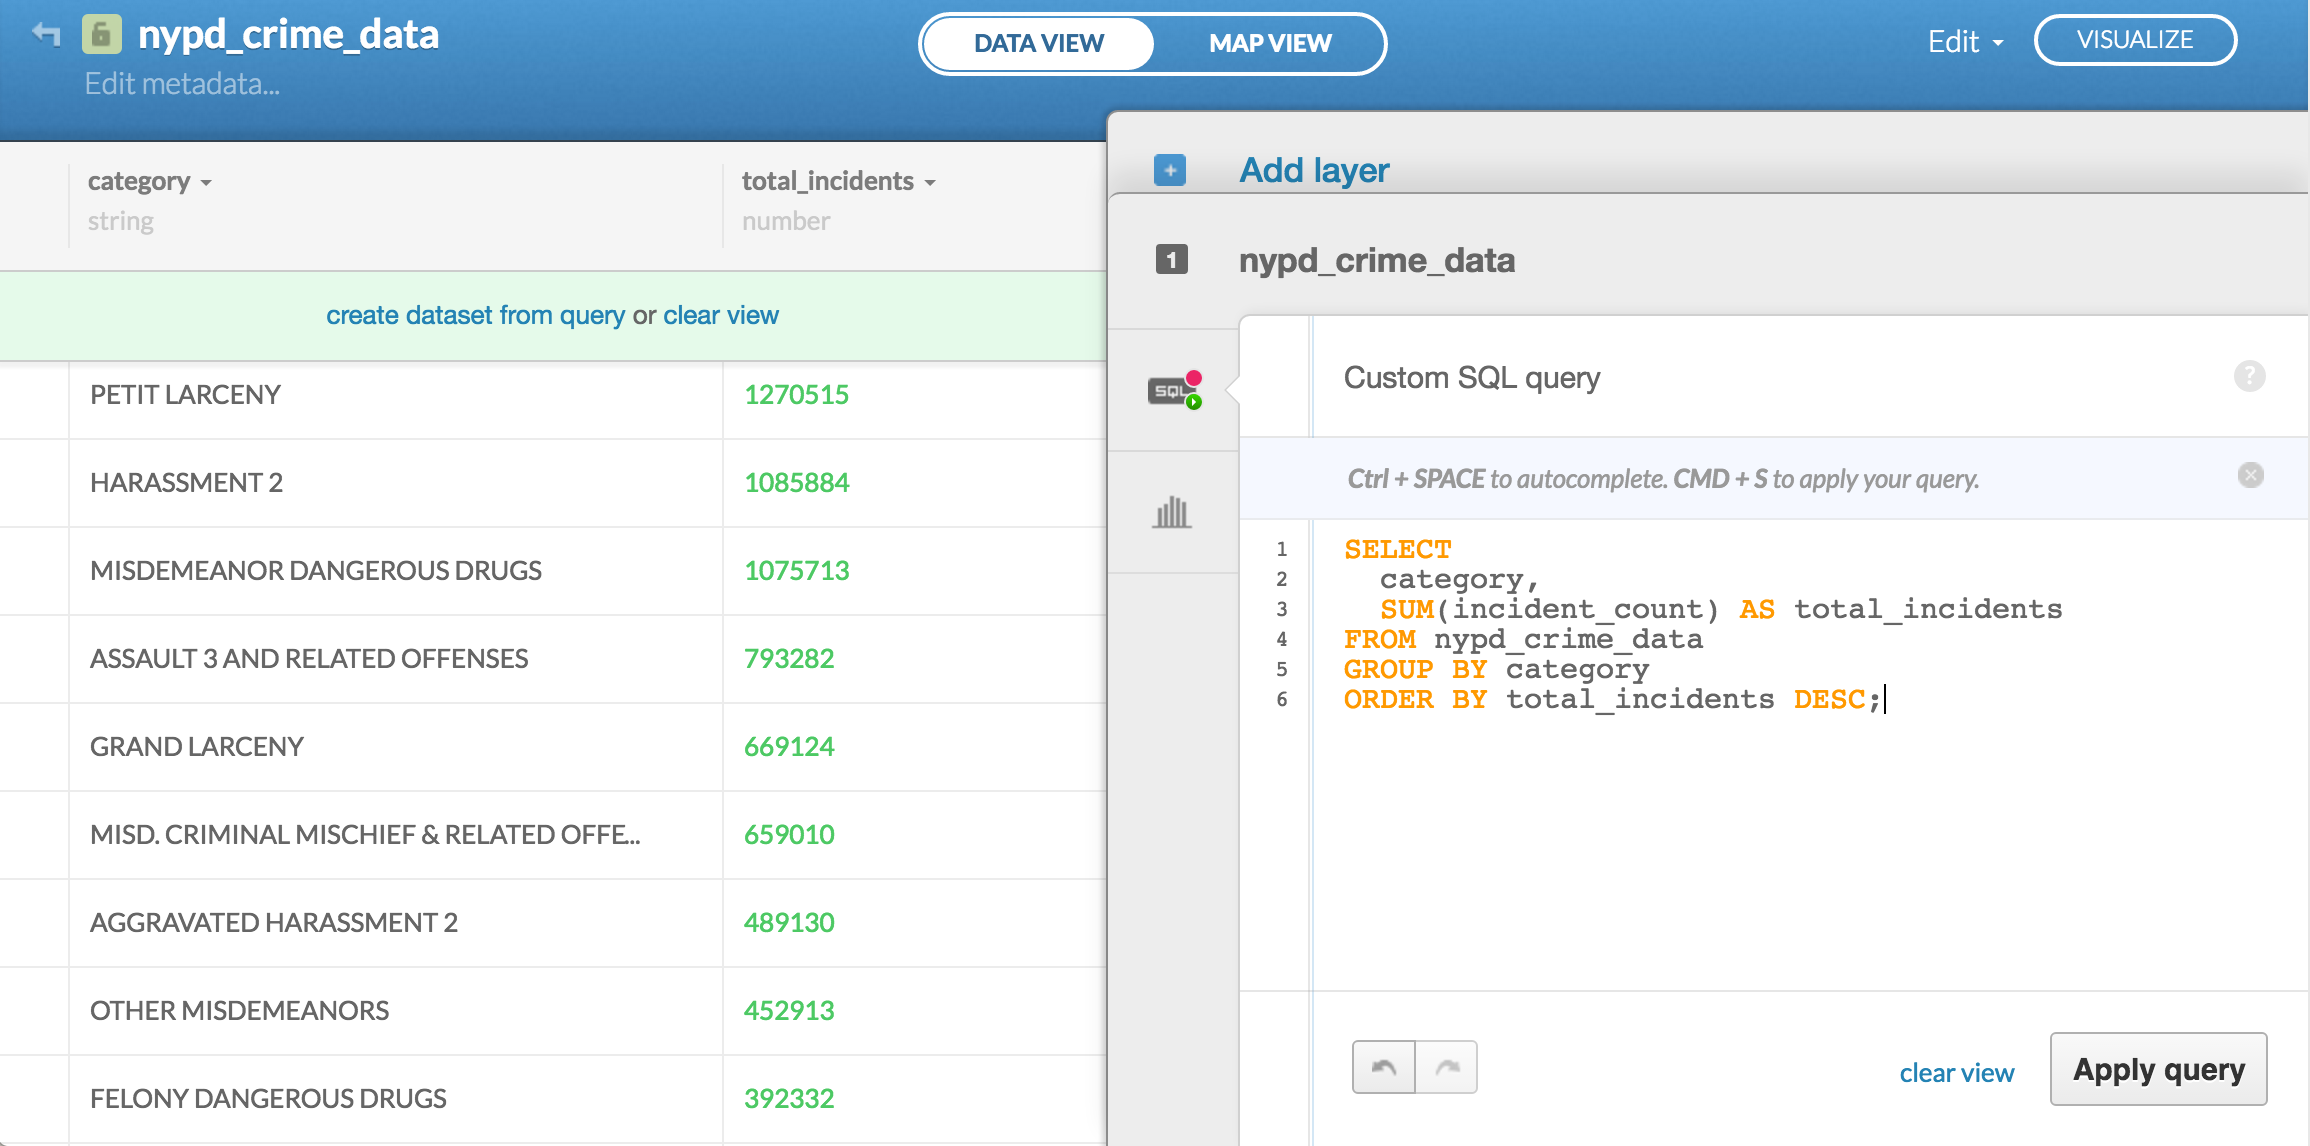
Take special note of the light-green bar that provides 2 clickable options: "create dataset from query or clear view":
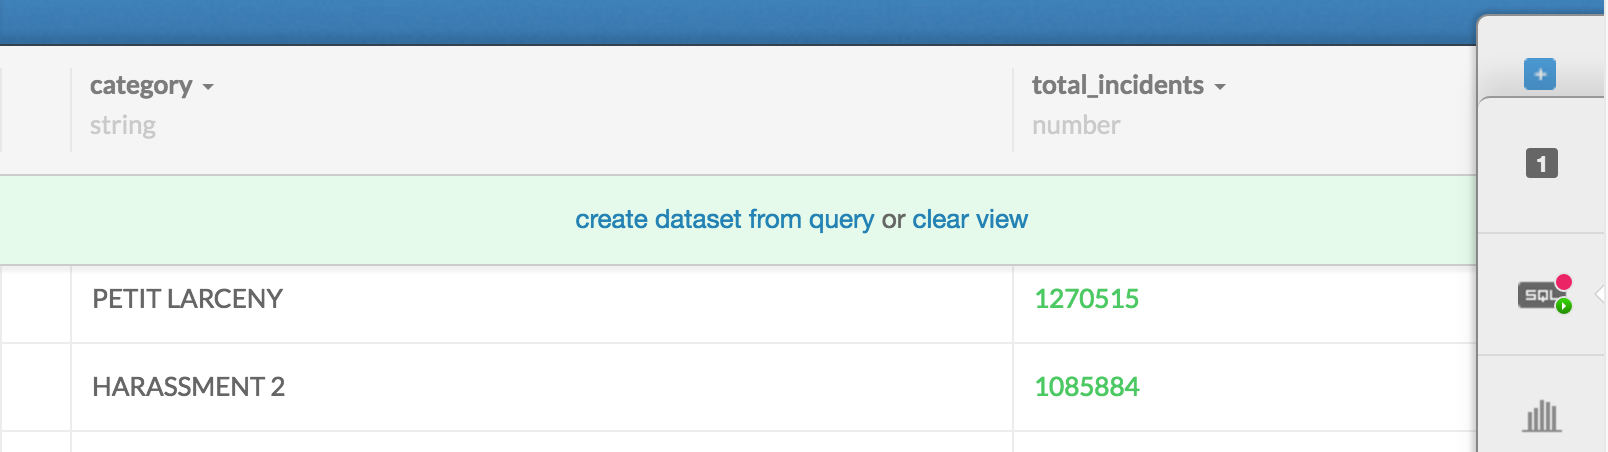
By executing a SQL query, we've effectively created a new view of the underlying dataset – i.e. whatever comes back as the result rows. CartoDB gives us the option of physically creating a new dataset from the result rows
We don't want to do that with this COUNT query, so go ahead and click clear view to see the original data.
Joining precinct to a single row of crime data
So the nypd_crime_data contains a "tidy", vertically-oriented version of the NYPD historical crime data spreadsheets. For every precinct, there is a row for every combination of year (15 years worth) and category – 39,780 rows in all.
While it's trivial to logically relate the crime data to each precinct, it is challenging to visually relate many rows of data to a geographic shape. In fact, this is the fundamental challenge of any data visualization – to reduce complex data to a 2-dimensional plane.
So let's start with the most straightforward strategy: who cares that we have 15 years of historical data? Let's just look at the most recent year's numbers (2014). And let's just look at one category of crime: 'MISDEMEANOR DANGEROUS DRUGS'.
Here's the query to just SELECT that data:
SELECT
  precinct,
  incident_count AS misd_drugs_2014
FROM nypd_crime_data
WHERE
    year = 2014 AND
    category = 'MISDEMEANOR DANGEROUS DRUGS';
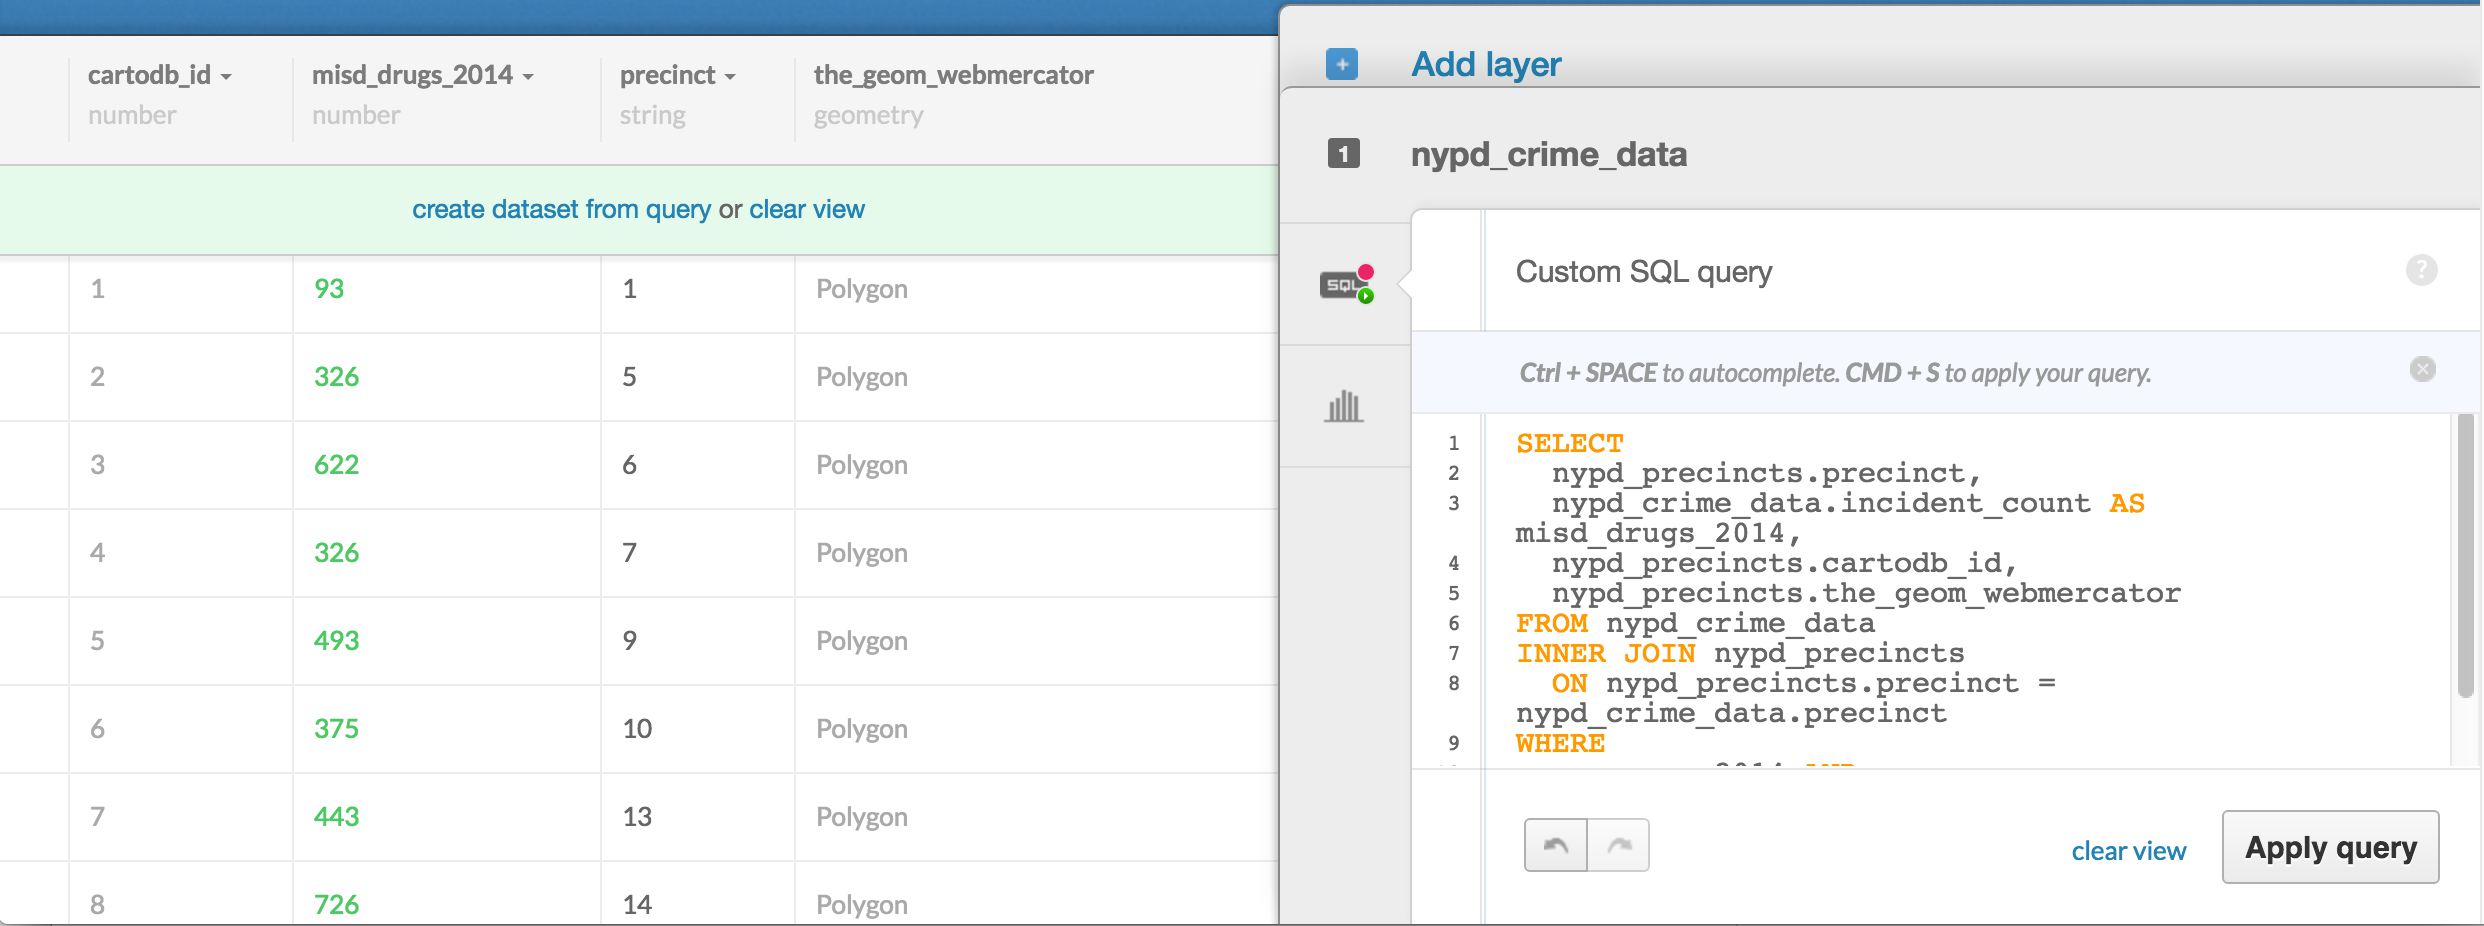
And then to join it to the nypd_precincts table:
SELECT
  nypd_precincts.precinct,
  nypd_crime_data.incident_count AS misd_drugs_2014
FROM nypd_crime_data
INNER JOIN nypd_precincts
  ON nypd_precincts.precinct = nypd_crime_data.precinct
WHERE
    year = 2014 AND
    category = 'MISDEMEANOR DANGEROUS DRUGS';
An important thing to note: the only thing that's actually changed is that I've added the INNER JOIN clause (which also requires being specific about tables in the SELECT clause).
Otherwise…the result rows are exactly the same as without the INNER JOIN. This is intentional, because the nypd_precincts dataset does not itself have any columns of crime data or context that is necessary to include along with what nypd_crime_data gives us.
So what's the point? So that we can display nypd_crime_data's insights on a map. Remember that nypd_precincts, being a dataset derived from a shapefile, has the geospatial data needed for CartoDB (and any other mapping application) to put things on an actual map.
Mind your datatypes
A quick technical note: If you run the previous query, you might run into an error.
If you've been using exclusively SQLite so far, you've probably not run into the issue in which trying to compare text strings to numbers throws an error. SQLite is pretty laid-back about that and so won't complain about this:
SELECT 'a hundred' = 100;
But the flavor of SQL used by CartoDB – PostgreSQL – will throw an error:

Or, in our actual situation, if the precinct column for nypd_precincts is a number (i.e. an integer), but the nypd_crime_data has a data type of a string, our CartoDB query will fail with an error of:
operator does not exist: integer = text
So you can do one of 2 things:
1: Change the data type of the column nypd_precincts.precinct to a string:
2: Alter the SQL query to specify that when comparing the nypd_precincts.precinct column, its value should be coerced to a data type of text:
SELECT
  nypd_precincts.precinct,
  nypd_crime_data.incident_count AS misd_drugs_2014
FROM nypd_crime_data
INNER JOIN nypd_precincts
  ON nypd_precincts.precinct = nypd_crime_data.precinct::text
WHERE
    year = 2014 AND
    category = 'MISDEMEANOR DANGEROUS DRUGS';
CartoDB's conventions for geospatial data
As we noticed earlier when uploading nypd_crime_data as a dataset, CartoDB took the liberty of prepending 2 columns of its own: cartodb_id and the_geom:
We might assume that cartodb_id is some kind of primary key convention used by CartoDB.
As for the_geom? Perhaps that's where CartoDB keeps shape data.
For example, if we want to represent the following data on a map:
| category |
incident_count |
precinct |
year |
| MISDEMEANOR DANGEROUS DRUGS |
465 |
13 |
2000 |
How is CartoDB supposed to know what the geospatial representation of that statistic should be? The precinct column itself is just the value 13 – which may have meaning in the real-world but not to a mapping program.
In other words, CartoDB can't magically make shape data appear in our nypd_crime_data table when no such data existed in the original table. But it does know what to do with nypd_precincts.
So the data for the geospatial shapes of the NYPD precincts? That's in nypd_precincts – CartoDB added cartodb_id and the_geom to that dataset, too, though we might not have noticed because we were not familiar with the plaintext representation of the NYPD shapefile:

Of course, this is why we learned SQL in the first place: to be able to tell the computer: "I want this number to be attached to this other thing" – the latter "thing" being the geospatial shape of NYPD Precinct 13.
Note: I'm deliberately skipping over a deeper explanation of cartodb_id and the_geom – it's not necessary for what we're trying to do, yet. But of course you can look up the documentation yourself.
How to tell CartoDB where exactly to put your data on a map
Note that the_geom in nypd_precincts is simply the value, Polygon. But if you double-click that column, you'll see a data structure that appears to represent the boundaries of the corresponding precinct with a series of latitude and longitude coordinates:
{
  "type": "MultiPolygon",
  "coordinates": [
    [
      [
        [
          -74.04387762,
          40.69018768
        ],
        [
          -74.04350596,
          40.68968736
        ]
      ]
    ]
  ]
}
It's obviously not important to see it in the spreadsheet-like view of the dataset, hence, CartoDB's use of the value Polygon to simplify the view.
So let's add the cartodb_id and the_geom from the nypd_precincts table to our previous SQL join query – actually, instead of specifying the_geom column, I use the_geom_webmercator instead, which is a hidden column that CartoDB wants us to use when doing conventional mapping:
SELECT
  nypd_precincts.precinct,
  nypd_crime_data.incident_count AS misd_drugs_2014,
  nypd_precincts.cartodb_id,
  nypd_precincts.the_geom_webmercator
FROM nypd_crime_data
INNER JOIN nypd_precincts
  ON nypd_precincts.precinct = nypd_crime_data.precinct
WHERE
    year = 2014 AND
    category = 'MISDEMEANOR DANGEROUS DRUGS';
The resulting data view of the dataset shouldn't seem particularly interesting:
But the map view of the dataset is where we see the fruit of our SQL labor:

OK, so it's not that immediately interesting. But at least we have map shapes. Before moving on, I recommend clicking the create dataset from query option – our join of nypd_precincts and nypd_crime_data can be its own standalone thing. Which is fine, because we'll be making other joins and subsets from nypd_crime_data, independent of our current one.
(I also think that making a new, separate dataset helps with performance issues, though I don't know if I'm just imagining that…)
This new dataset I've created from the join, I dub thee: nypd_precincts_misd_drugs_2014
How to tell CartoDB to present the map based on our data
So now we jump into the Wizards subpanel, which we learned in the previous tutorial, to tell CartoDB how the colors and other visual elements should be guided by the data in the nypd_crime_data table, i.e. the misd_drugs_2014 field.
Creating a choropleth map
In the previous tutorial with just the precinct shapefiles, we used the Map layer wizard to create a "Simple" map. With our newly-joined data, we can create a "Choropleth" map:

You can read CartoDB's tutorial on making "Your First Choropleth Map" for more details. But basically, the concept behind a choropleth map is: color each map shape based on where one of its data values compares to a range of data values.
In other words, for our situation, we want to make each precinct a darker color based on how high its corresponding misd_drugs_2014 value is.
There's not much to it other than clicking the Choropleth button in the Map layer wizard, and then in the Column drop-down menu, picking the proper field: misd_drugs_2014.
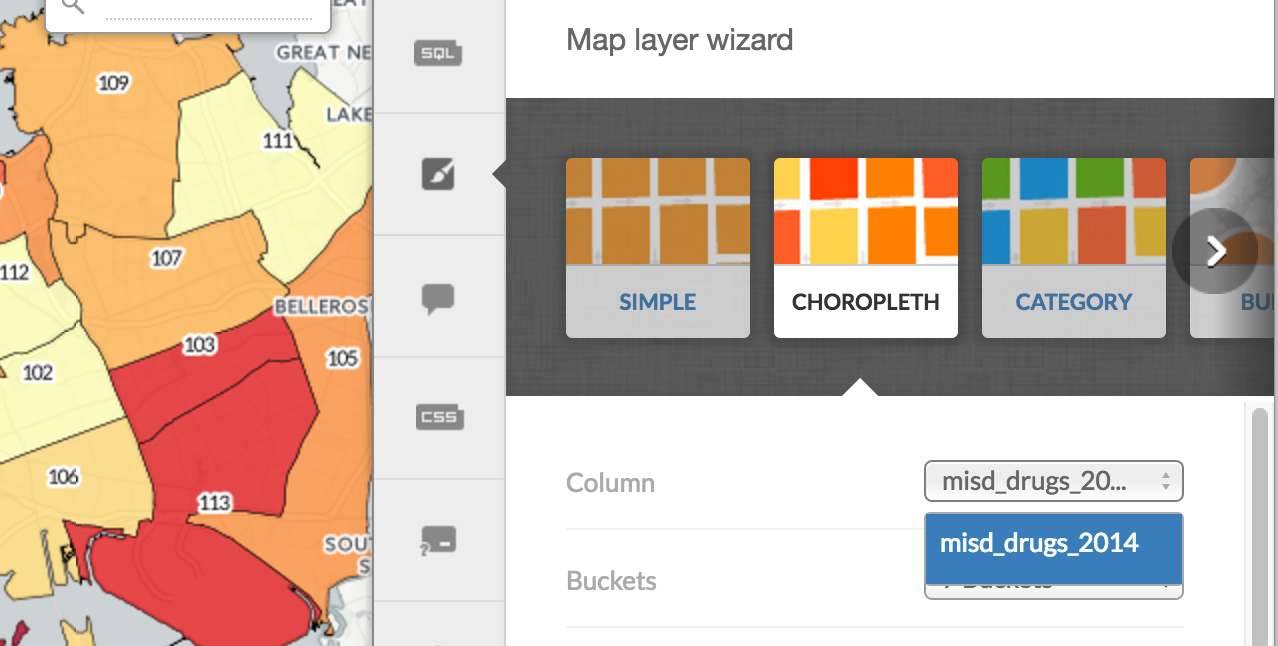
Every other visual element, such as the info window popups, can be configured as we learned in the previous tutorial.
Here's my final result as an embed: