The CartoDB Academy | academy.cartodb.com
In this tutorial, we learn how to add shapefiles for NYPD precincts onto a CartoDB map and then how to style them and add some interactivity.
The finished map can be found here.
Table of contents
- The data
- Upload shapefiles to CartoDB as a dataset
- The Views
- Basic map styling
- Add a hover/popup effect
- Publishing a map
The data
The shapefiles can be found among those listed on the NYC Planning Department: Political and Administrative Districts page.
The actual zip file: Police Precincts (Clipped to Shoreline)
Upload shapefiles to CartoDB as a dataset
The link to your Datasets page can be found in the top menu bar:
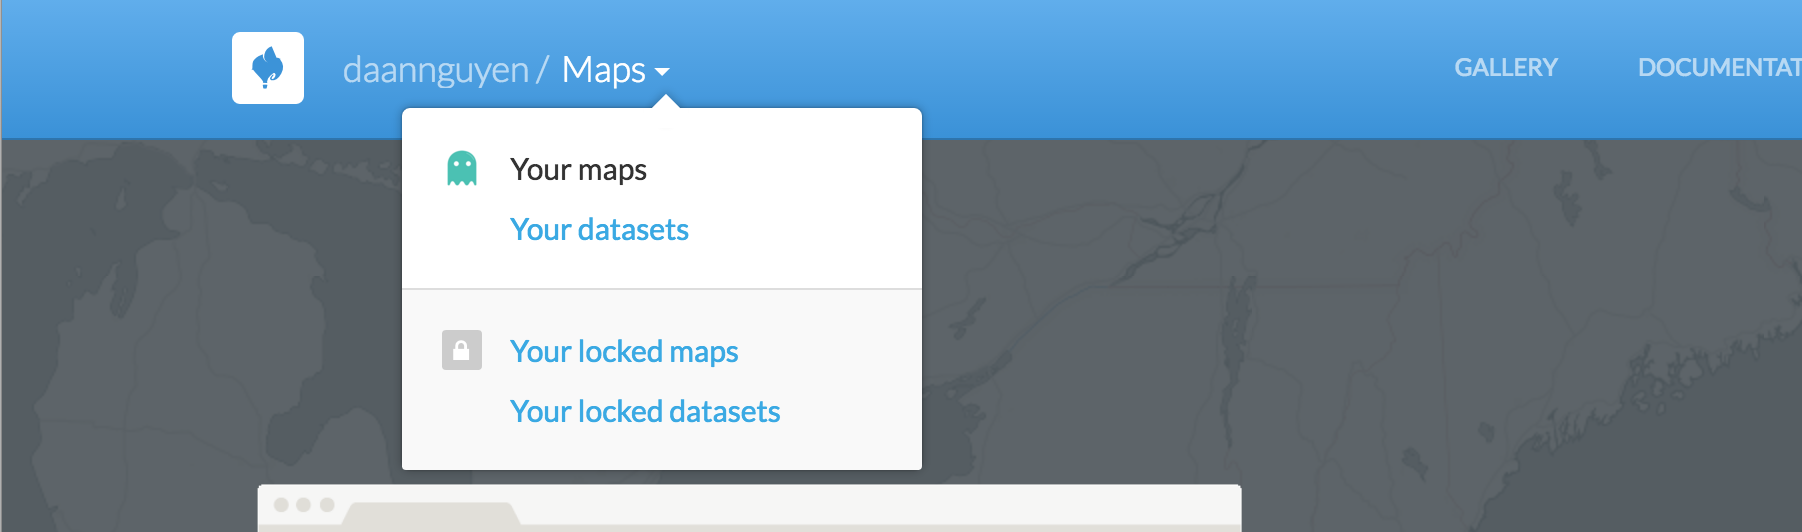
Clicking Your datasets will take you to a listing of the datasets you've uploaded so far.
Make a new dataset
You can create a new dataset from scratch, but you'll typically find yourself uploading data files you've already created into CartoDB. These include anything from CSV text files to Excel spreadsheets to zipped folders of shapefiles.
Click the green button titled NEW DATASET to bring up the page for uploading new datasets:

You can even save yourself the step of downloading the data file, as CartoDB lets you paste in the URL of the zip file to be uploaded. However, I highly suggest taking the time to actual download and open data files rather than blindly send them into your applications:

The Views
CartoDB has the concept of a Data View and a Map View. For every dataset you create – even before you create what CartoDB technically considers to be a publishable map – you can view what the data looks like on a map. Conversely, for every published map you make, there is an underlying spreadsheet-like dataset.
It's not too different from QGIS in which you find yourself creating multiple variations (i.e. copies) of datasets and layers before creating the final publishable map.
The Data View
Upon uploading the precinct shapefiles, CartoDB takes us to the Data View of this newly created dataset. This is a nice feature for seeing shapefile data as a spreadsheet, even though shapefiles contain complicated, nested data structures needed to define visual polygons.
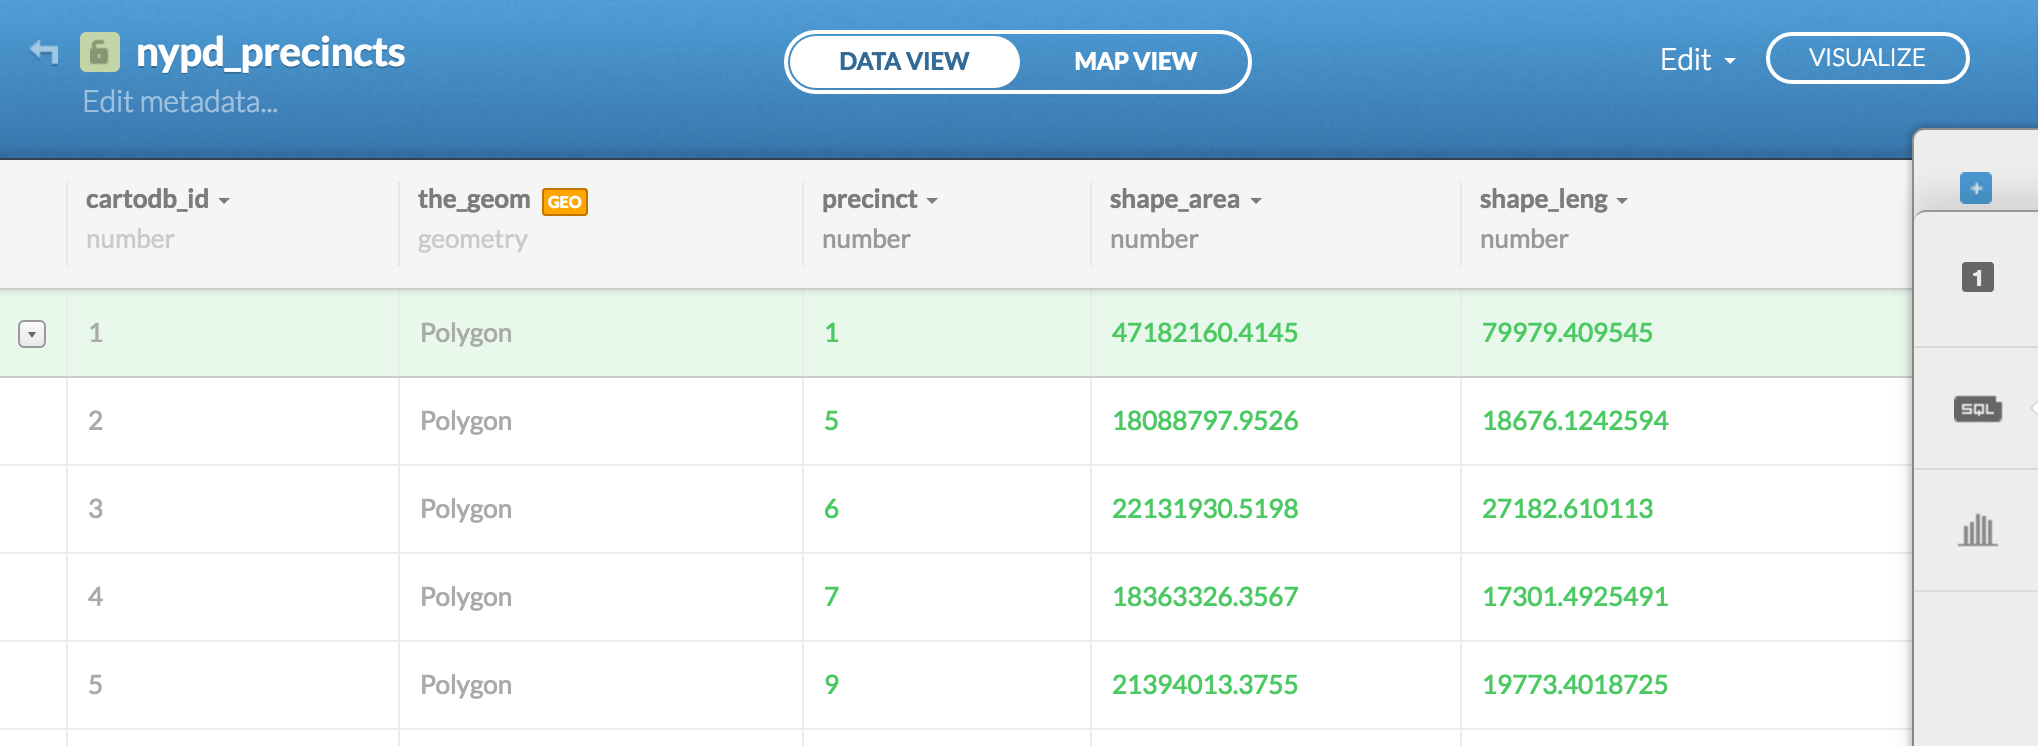
You can see the dataset I've uploaded and named as nypd_precincts here. In your own version of the dataset, if you double-click any of the values in the column titled, the_geom – they're all named Polygon – you'll see the underlying geospatial data (I do not recommend actually editing such data by hand):

The Map View
Because the precincts shapefile is inherently geospatial, clicking on the MAP VIEW button in the top navigation will take you to an interactive map in which the precincts are automatically and conveniently rendered:

The auto-dataset analysis feature
Usually, after uploading a new dataset and attempting to map it, CartoDB will attempt to analyze it and then suggest "interesting" maps for you to try out.
My suggestion is to close that box (by clicking the X icon). First of all, the feature seems to add a slight performance drag as it attempts to read the data. But more importantly, there should never be a situation in which you are so ignorant of what's in your own data that you need a computer's general algorithm to tell you what to do – akin to having Clippy write your entire resumé for you.
But if you're curious, go ahead and see what interesting maps CartoDB has found for you in the precincts shapefile:

Not entirely compelling – though it's not CartoDB's fault, of course. It's just that there's nothing inherently interesting about the precincts data except for the shapefiles being linked to each precinct number. But you should've already known that by looking at the DATA VIEW.
Basic map styling
We're actually almost done with the objective of this tutorial. The convenience of CartoDB allows us to render a map of NYPD precinct shapefiles basically as soon as we've finished uploading the shapefiles.
With the "data" part of this tutorial done, let's explore some of the styling options we have in CartoDB.
The Map Layer Wizard
On the right side of the screen, you should see a list of icons. Clicking on any of them will roll out a side panel full of new ways to configure and wrangle both the map and the underlying data.
For now, click on the paintbrush icon to bring up the Map Layer Wizard:
This wizard allows you to choose from a variety of stock templates for maps. Keep in mind that the featureset of your map's interactivity is highly dependent on its underlying data. The more complicated the data, the more complicated the kinds of maps you can build.
Conversely, when your data is simple – as it is with the precincts shapefile – you can only make simple maps. By default, the wizard will have chosen to make the Simple type of map. You can try out the other maps types, such as Choropleth and Category – but you'll see that there's not much point. After all, the precincts data contains no other data besides precinct numbers and their corresponding geospatial boundaries.
Changing polygon color and fill
The options are pretty self explanatory. Below I've configured the map to fill each shape with a purple color, with a transparency/opacity value of 0.5 (i.e. halfway translucent). I've also used the Polygon Stroke option to draw a 1-pixel black line that is also partially translucent:

Adding labels
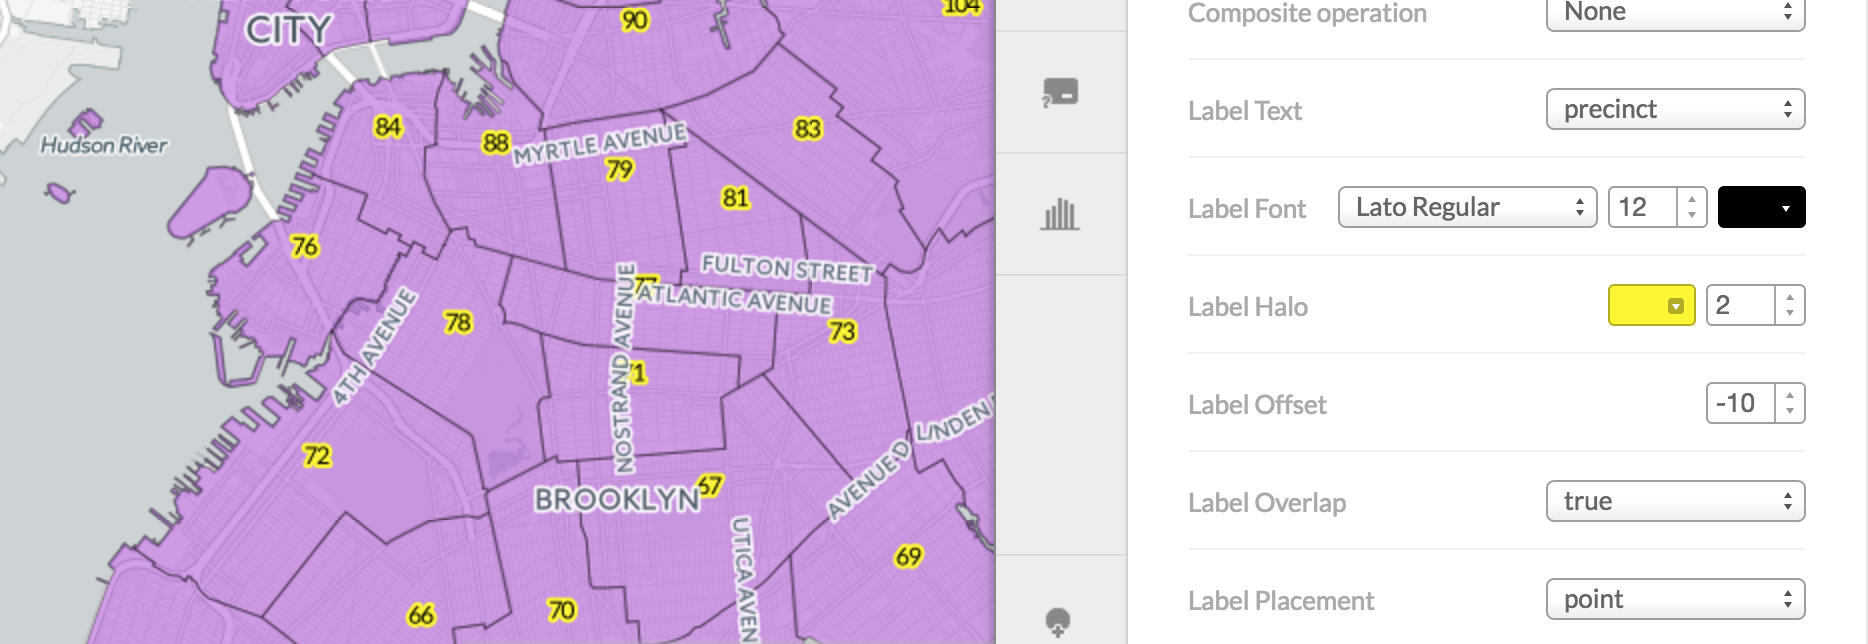
The Map Layer Wizard contains a number of options for adding and styling text labels for each geospatial feature on our map layer. Typically, these labels come from the underlying data.
Since our only textual data in the precincts shapefile are the precinct numbers, that's pretty much our only option for text labels here. It's not necessary to have text labels for every map that you do, as they necessarily add clutter. In this case, it may seem like a worthwhile option, as most people aren't able to look at a map of NYPD precincts and identify which shape belongs to which precinct.
The label options are pretty straightforward. One nice styling option is the Label Halo: I've created a yellow halo around the text labels to make them more readable against the purple shapes:
Add a hover/popup effect
One of the nicest features of CartoDB is the ability to add interactivity to the map in the form of click/hover interactions. Again, like text labels, this isn't always necessary. In fact, I believe a core part of map design is creating a visualization that tells a story without requiring a user to click dozens of shapes/dots to find out important information.
That said, sometimes the details of the data are interesting on their own but cannot be fully explained in the visual layer. This map of precinct shapes is not such a scenario.
However, we might as well try out the Infowindow Panel, which can be accessed by clicking the word-balloon icon.

You can configure both the Click and the Hover option – though I suggest doing only one or the other – there's never really a reason to have two different things to happen when a user attempts to interact with an object on a map.
Below, I've configured the Hover handler to display the precinct label with a "dark" theme:

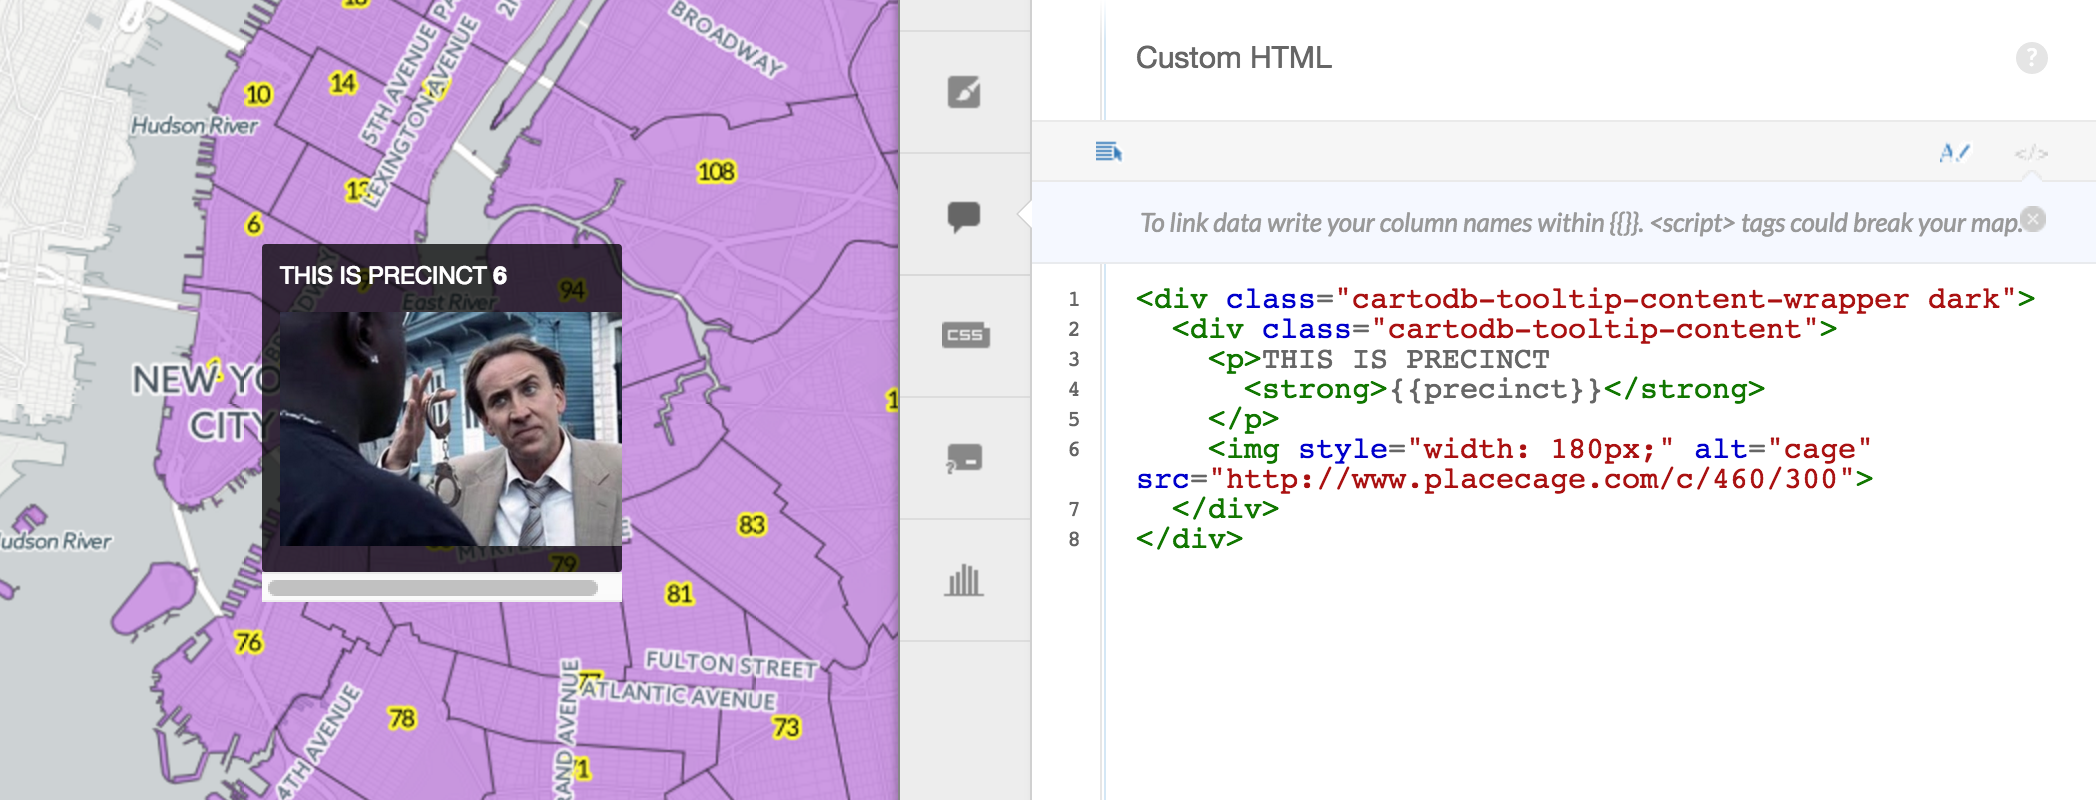
Customizing HTML for an infowindow
CartoDB allows for much more customization of the info window, even allowing you to write your own raw HTML. You can access this feature by clicking the very tiny icon represented by two angle brackets and a slash: </>

Below is the raw HTML needed to display some obnoxiously all-caps text and a picture of Nicolas Cage in some movie in which he plays a cop:
<div class="cartodb-tooltip-content-wrapper dark">
  <div class="cartodb-tooltip-content">
    <p>THIS IS PRECINCT
      <strong>{{precinct}}</strong>
    </p>
    <img style="width: 180px;" alt="cage" src="http://www.placecage.com/c/460/300">
  </div>
</div>
Publishing a map
If you turn your attention to the main map view, you'll see a few buttons and menus that allow further configuration of the map, as it will be seen by your users. In fact, however you choose to zoom and pan the map, that will be the default view when you finally publish the map and make it public.
Changing the base map
One of the main visual publishing options you'll want to play with is changing the base layer of the map. There's more than a dozen layers and variations for the map style upon which your data is rendered. Below, I've shown how to access that menu and change the style to Stamen Toner:

Making the map public
Up to this point, we've been playing around with the Map View of our data, but we haven't technically created a publishable map. In the top right of the page, click the Visualize button.
This will create a Map which will now be listed in your account's listing of maps.
You'll also see a Publish button which will reveal the shortlink to your map as well as an embed code. Below, I've pasted the embed code for my finished map:
And that's it, we've learned how to import shapefiles and create a publishable map. Of course, NYPD precinct shapefiles aren't interesting on their own. In the next tutorial, we'll learn how to join crime data by precinct to the precinct shapefiles to create a Choropleth map.