New SFO flight paths causing record airplane noise complaints | peninsulapress.com
Final Database and Visualization Project
Combine your database and data visualization skills to find, filter, analyze, and visualize data as a publishable package for the web.
Assignment
Deliverables
Create a Folder in your PADJO2015 folder named: PADJO2015-FINAL-PROJECT.
In that folder should be these files:
- Final-Project-Article - A document aimed at the general reader, containing these components:
- Prose of at least 500 words in typical journalism style, explaining what you’ve created, the context for doing so, and why it is an important/interesting data story.
- Should also have a static screenshot of both the data chart and the data map (see more below), as well as URLs to that map and chart.
- A data map: Something similar to the QGIS mapping assignment, in which data is filtered and mashed up (such as boundaries and point data). You can use CartoDB.
- A data chart: Maps are bad at showing things like change over time and so forth. So make an interactive online chart that shows a view of the data that is not geographic.
- Final-Project-Writeup - This is a document containing these sections:
- Links and summaries to 3 other previously-published stories in the news media that relate to your topic, including how these articles helped you define your own project.
- Discussion about the visual design choices you made to make the story clear, including how you decluttered the data, the color choices you made, and so forth.
- A walkthrough of the data steps, including:
- Where you got the data, including a link to the landing page and, if possible, a direct link to the data download, i.e. a zip/csv/shapefile/etc
- The SQL queries you used to filter the data.
Please do this assignment on your own.
Requirements
Make a data map, CartoDB will be your best option likely
Make a data chart – using Google Sheets (and Pivot tables, if necessary) is probably your best choice.
You should have done at least a couple SQL queries to get the data into an interesting shape. If you managed to find a story in which the data involved simple clicking-to-download-then-uploading…that story might not be very complicated.
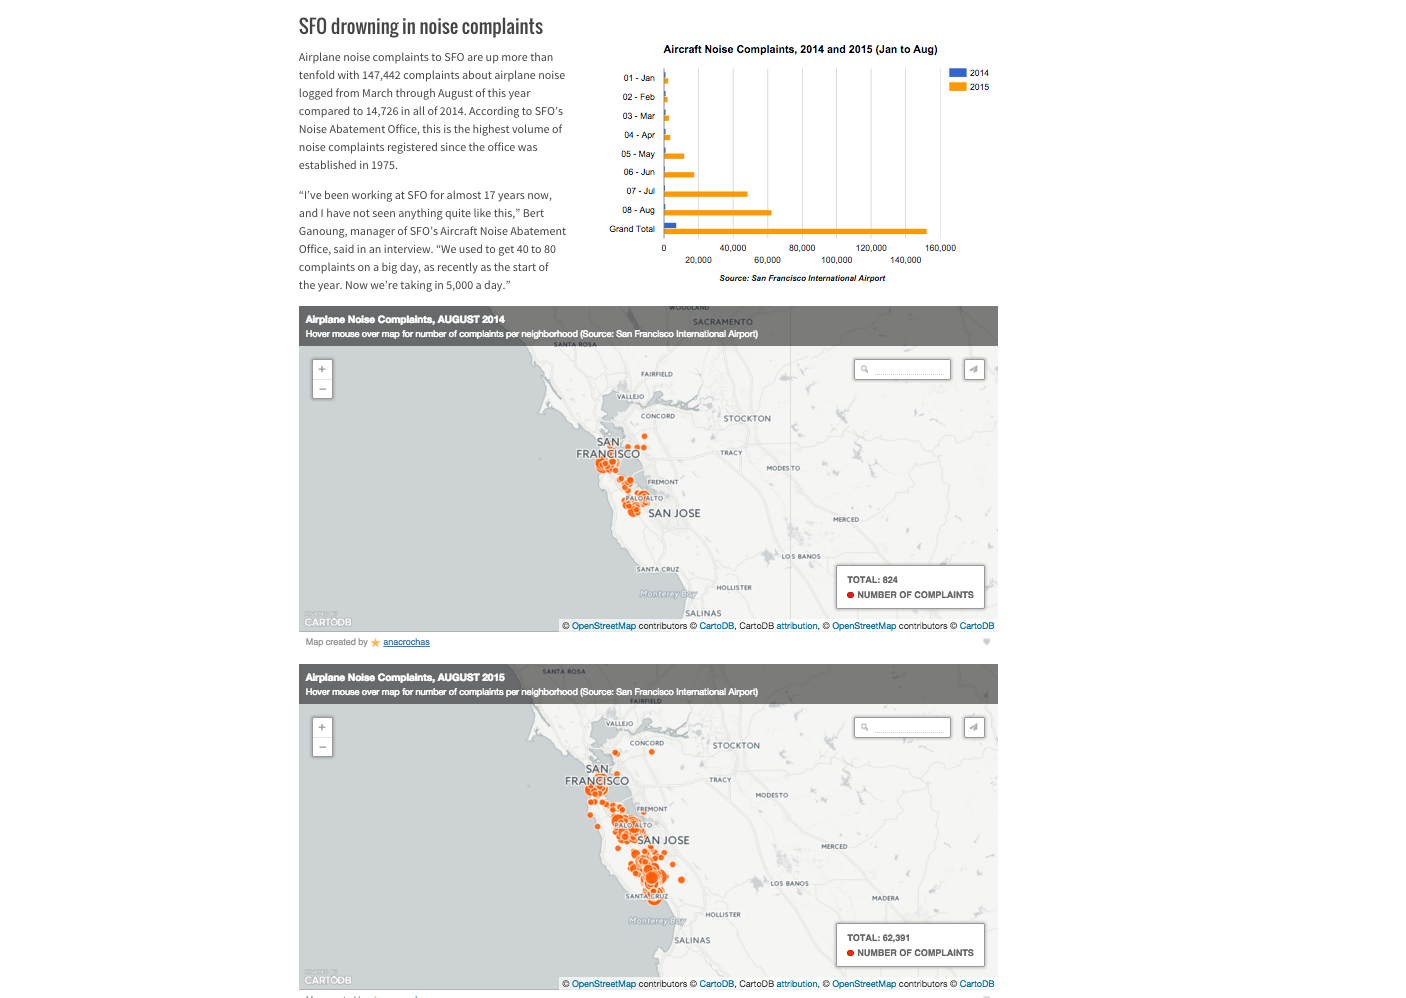
Ana's story on airport noise complaints
Check out the double-map and the chart:
Tufte and Snow
Revisiting a past discussion, recall that it was possible to visualize the data of the cholera epidemic as a map and chart. Obviously, you want to make a chart that isn't pointless:


References

How to map simple geographic shapefiles with CartoDB and do some basic customization of visual features.

A tutorial on using geospatial analysis, shapefiles and datasets from the U.S. Geological Survey, Census, and Department of Education to visualize the impact of Oklahoma’s earthquakes and explore possible investigative projects.