The CartoDB map embedded above overlays the location of present-day Starbucks locations on top of a choropleth map of Census 2000 data for median household income by Census tract.
This is a tutorial on how to use CartoDB's multiple layers feature to combine point and shapefile data.
(in progress, the barebones steps are described below)
Data
Note: I'm using Census 2000 files because I can't find the corresponding socioeconomic tables for 2010. They're probably somewhere on this page but I don't have a lot of experience working with Census data…
Census 2000 tract shapefiles
Census 2000 household incomes
Note, I've used a Python script to collate these five files into one. It's easy enough to do by hand, but you can just use my collated file:
/files/data/cartodb/census_2000_household_incomes.csv
If you're interested in collating the files yourself:
Source: NYC Planning Department socioeconomics page, 2000 Census
Download:
- Household Income in 1999, 2000:
+ Bronx
+ Brooklyn
+ Manhattan
+ Queens
+ Staten Island
Present-day Starbucks locations
I derived a list of Starbucks locations in New York by filtering the database of the city's restaurant inspections for businesses with "STARBUCKS" in the name.
The inspection dataset does not include geospatial data, so I wrote a Python script to use the Mapzen Search API to get latitude and longitude for each address – you can see the script here. It's not completely correct, for example, some LaGuardia locations are geocoded to JFK Airport. But it's pretty good for a free service with barely any configuration on my part.
You can download the geocoded Starbucks locations as a CSV here:
/files/data/cartodb/geocoded_starbucks.csv
Adding the Census tract shapefiles
Here's the simple map of just the 2000 census tracts:

Adding the Census households income data
After uploading the 2000 household income data, we can join it to the census tract shapefiles with this SQL:
SELECT nyct2000.*,
  total_households, median_household_income
FROM nyct2000
INNER JOIN household_incomes
ON household_incomes.borough = nyct2000.boroname
AND household_incomes.census_tract = nyct2000.ct2000;
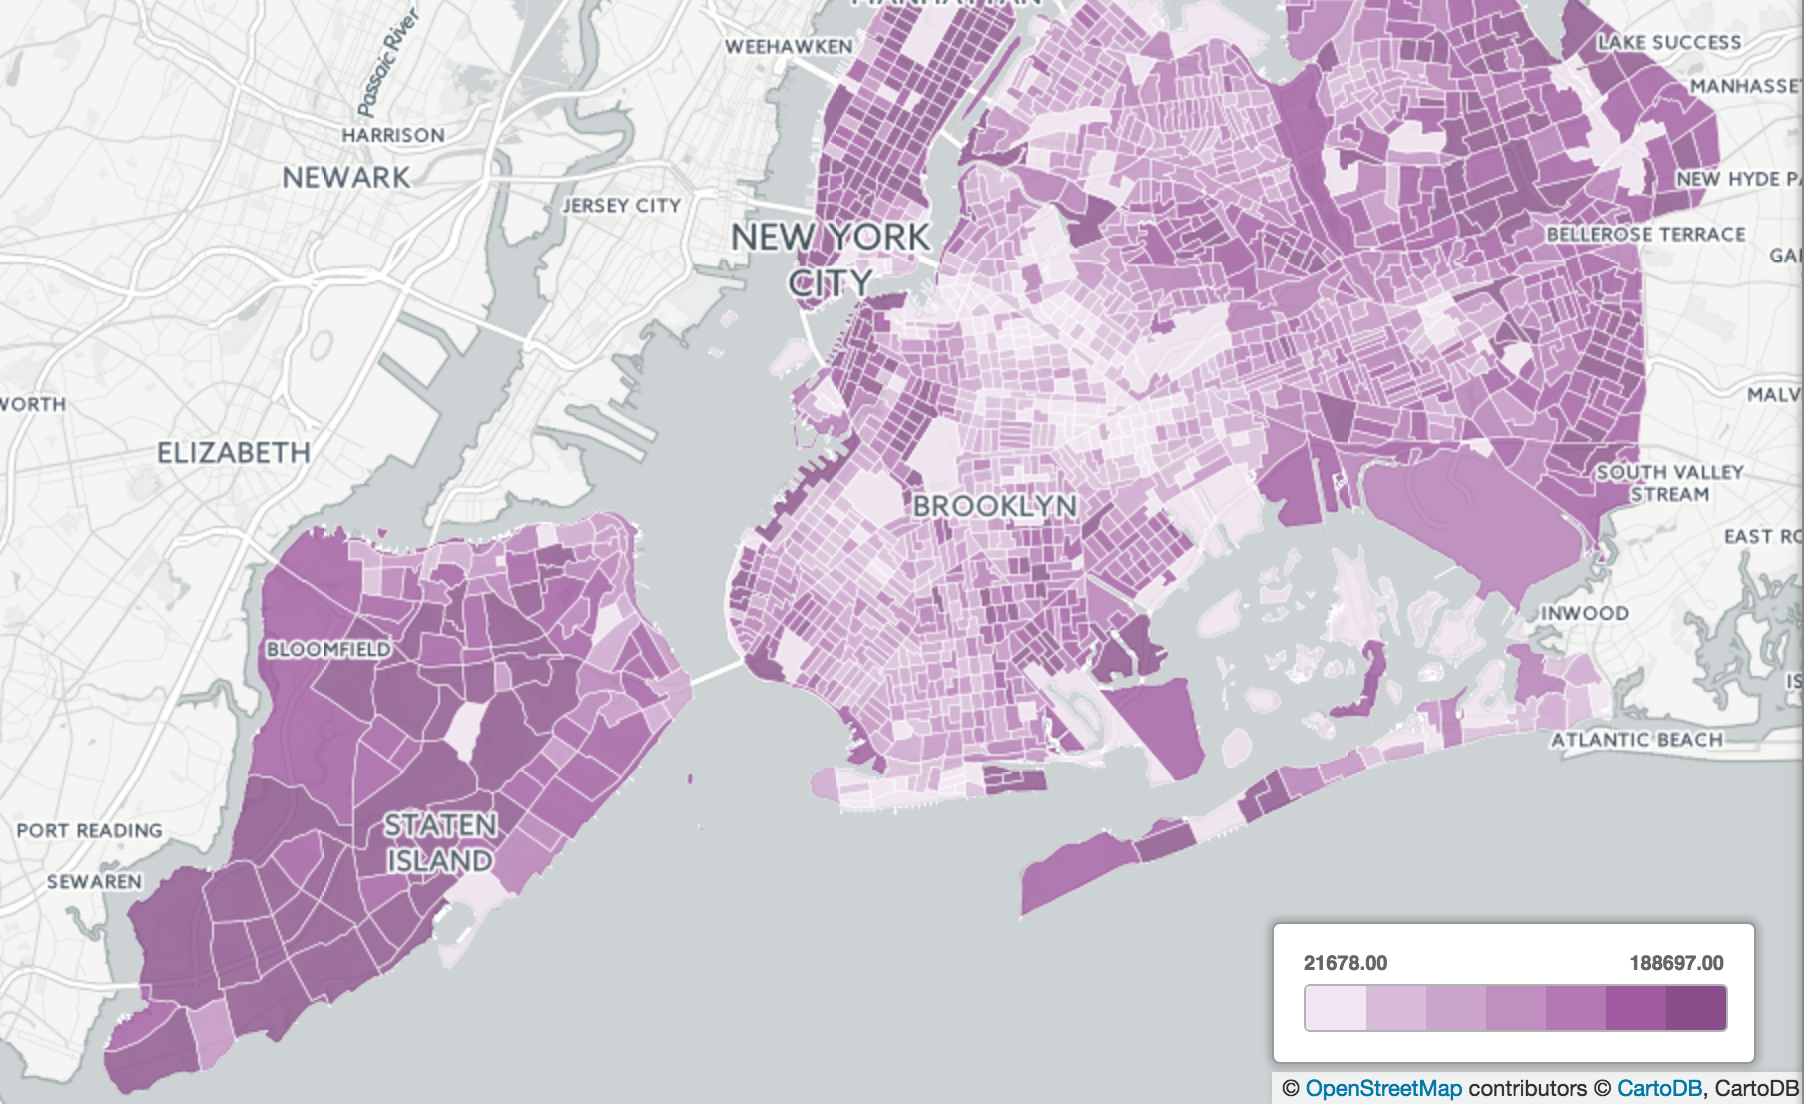
The resulting choropleth:
Adding the Starbucks point data
Upload the Starbucks data
Add a new layer
In the sidepanel, click on the top panel labeled Add layer
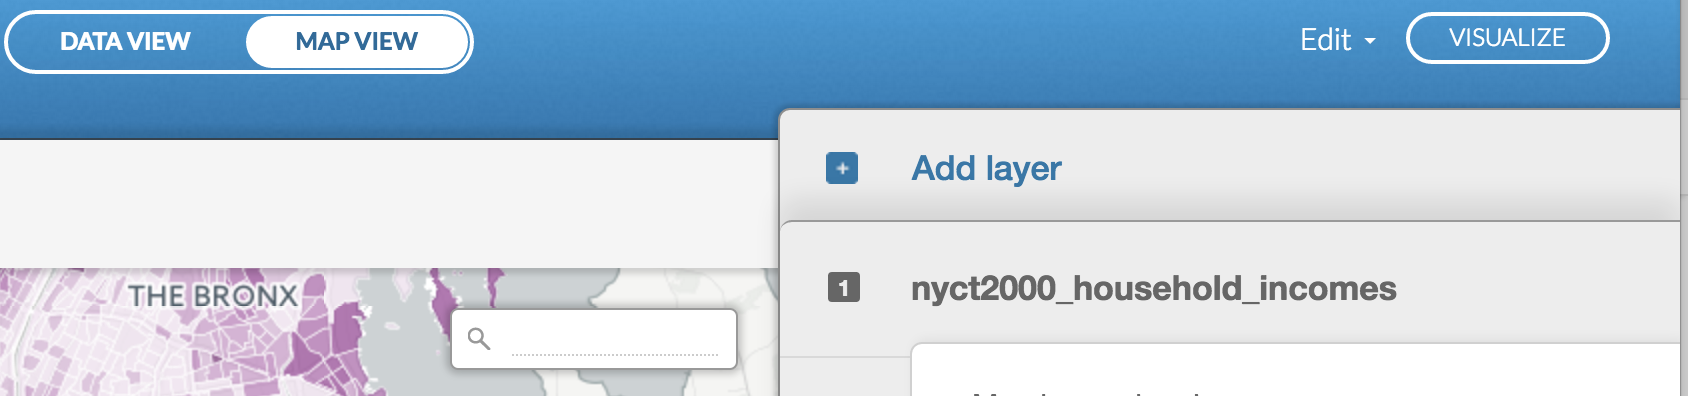
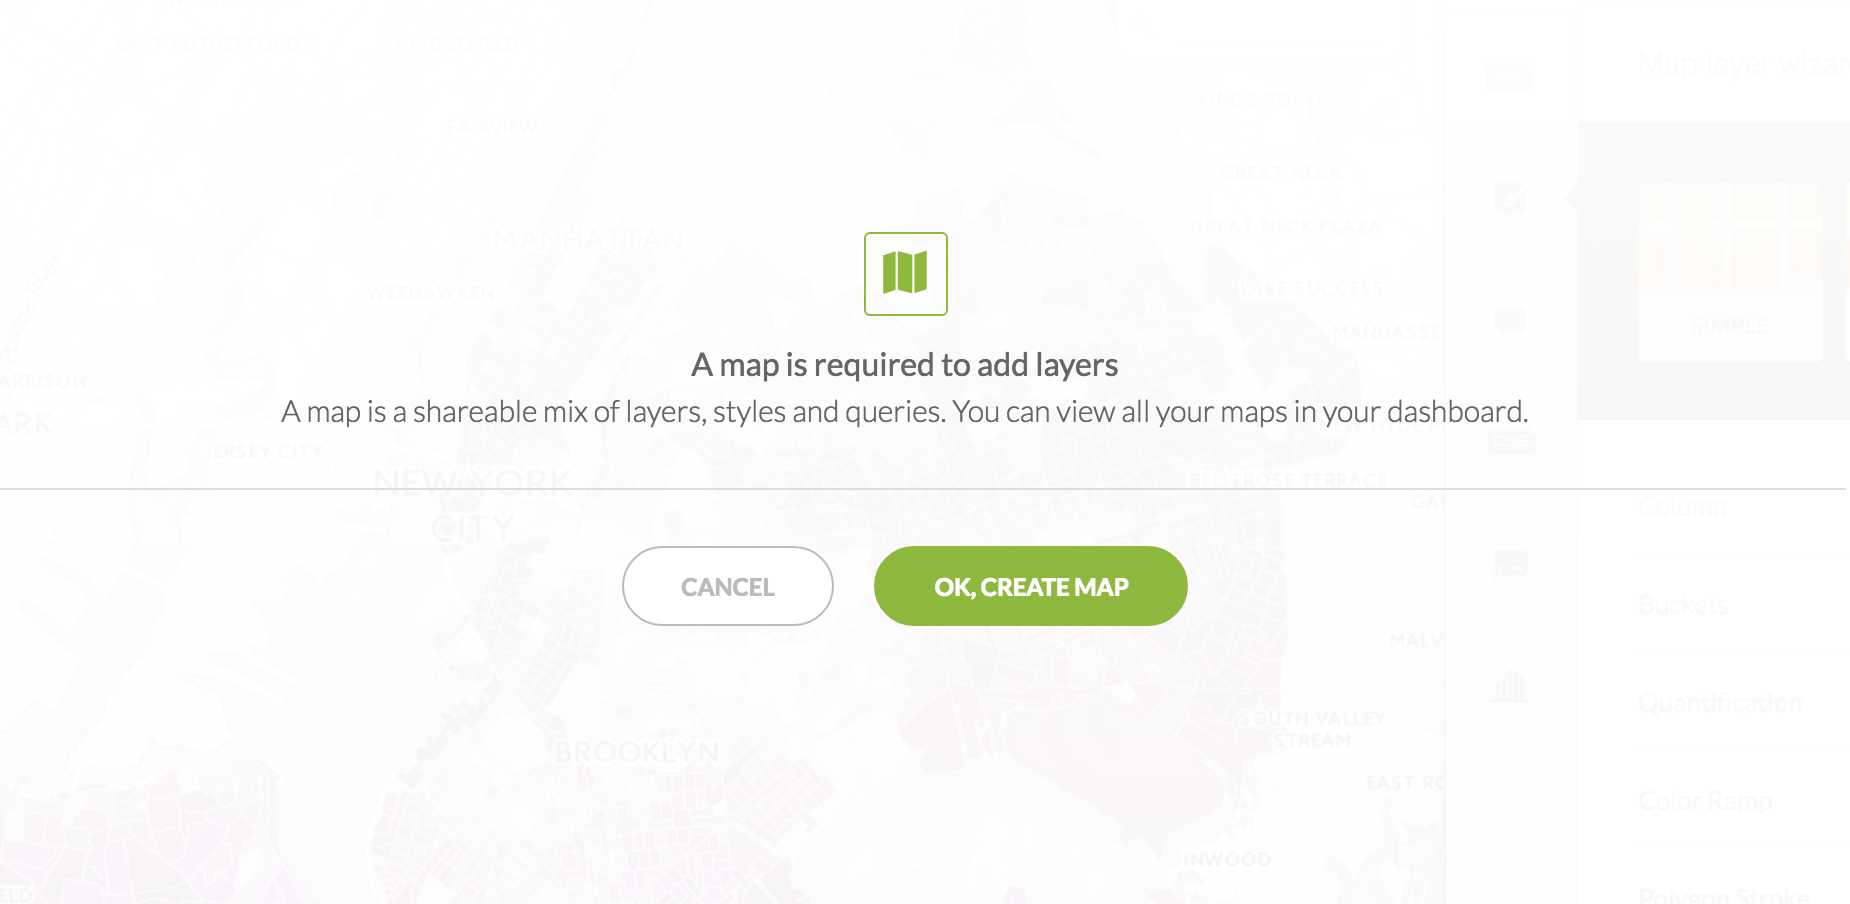
This will prompt you to create an actual map:
Then it will take you to your list of datasets. Add the geocoded Starbucks dataset.